Maths
Data Handling
Learning Objectives
- Understand what data is and how to collect it.
- Use tally marks to record data.
- Read and make a simple pictograph.
- Answer questions using information from a chart or pictograph.
- Find which item has the most or least count.
Let Us Begin!
Meena's teacher asked the class: "What is your favourite sport?" Some children said cricket, some said football, and some said badminton. The teacher wrote down all the answers on the board. This collection of information is called data.
But looking at a long list is confusing! So we use tally marks and pictographs to organise data and make it easy to read. Let us learn how!
What is Data?
Data is information we collect by counting, asking questions, or observing things around us.
Examples of data:
• How many children like each fruit in your class.
• How many cars, bikes, and buses pass your school gate in 10 minutes.
• How many runs each player scored in a cricket match.
• How many children like each fruit in your class.
• How many cars, bikes, and buses pass your school gate in 10 minutes.
• How many runs each player scored in a cricket match.
Tally Marks
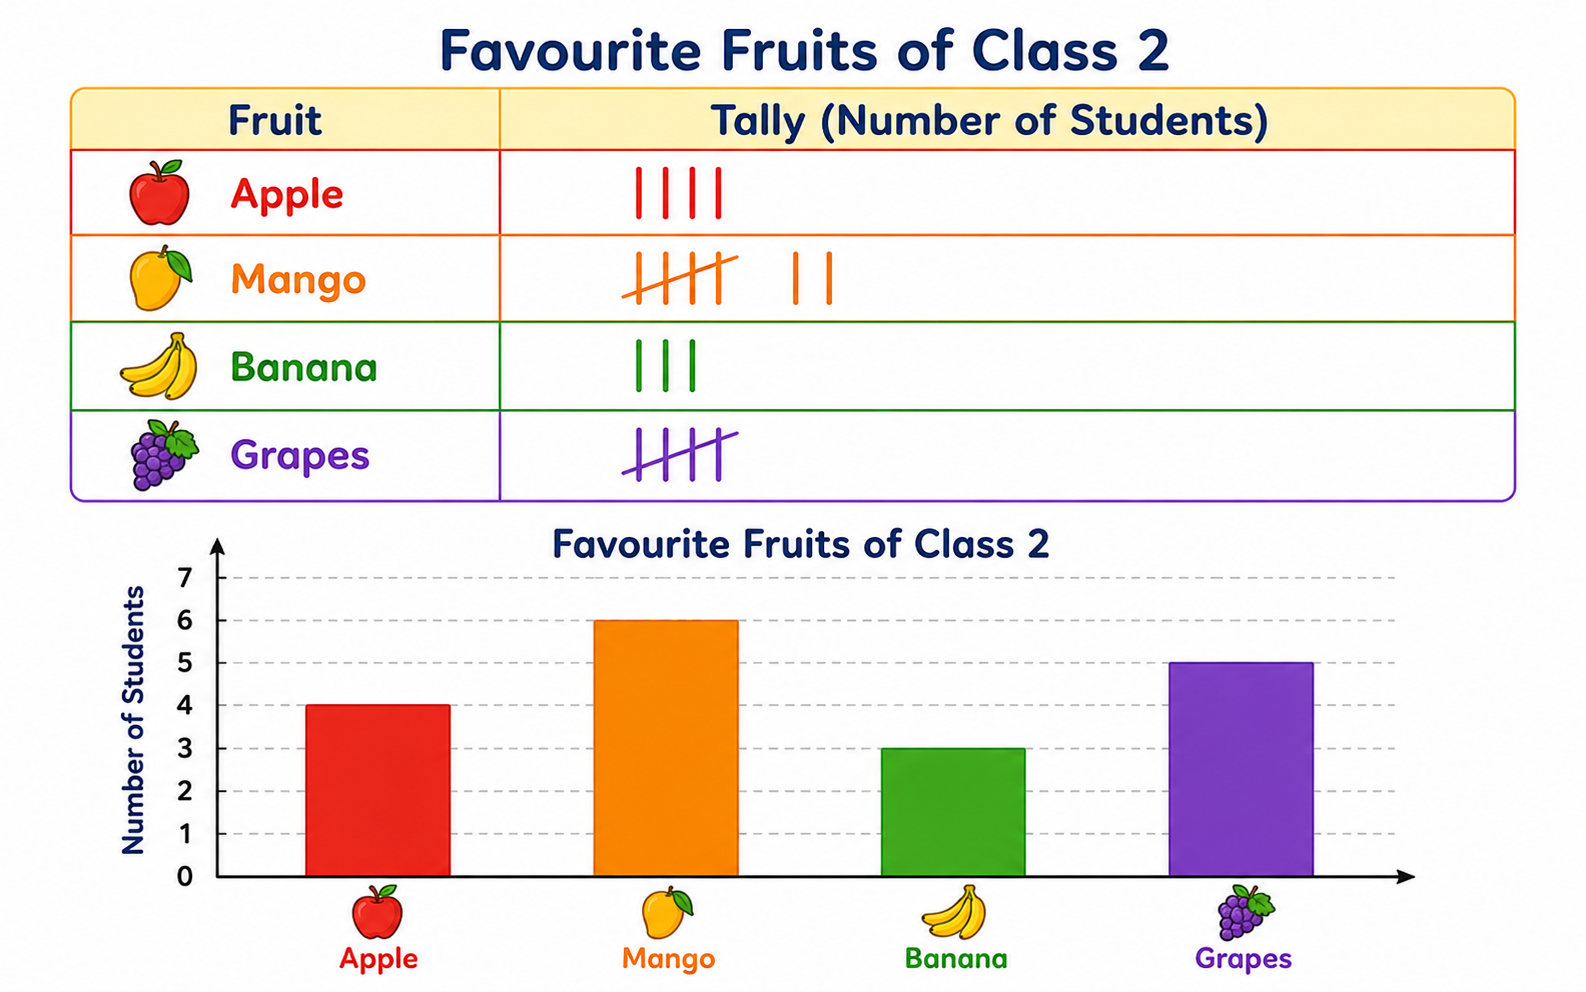
Tally marks are a quick way to count. We draw lines (|) to count. Every 5th mark crosses the previous 4 marks to make a group of 5.
How to draw tally marks:
1 = | 2 = || 3 = ||| 4 = |||| 5 =|||| (four lines with a cross)
6 =|||| | 7 = |||| || 8 = |||| ||| 9 = |||| |||| 10 = |||| ||||
1 = | 2 = || 3 = ||| 4 = |||| 5 =
6 =
Example: Arjun counted vehicles on his street for 10 minutes:
| Vehicle | Tally Marks | Count |
|---|---|---|
| Car | 6 | |
| Bike | 8 | |
| Auto-rickshaw | |||| | 4 |
| Bus | || | 2 |
From this data: Bikes were seen the most (8). Buses were seen the least (2). Total vehicles = 6 + 8 + 4 + 2 = 20.
Pictograph
A pictograph uses pictures or symbols to show data. Each picture stands for a certain number (usually 1).
Example: Favourite Fruits in Class 2A (Each 🍎 = 1 child)
| Fruit | Children who like it | Total |
|---|---|---|
| Mango 🥭 | 🍎🍎🍎🍎🍎🍎 | 6 |
| Banana 🍌 | 🍎🍎🍎 | 3 |
| Apple 🍏 | 🍎🍎🍎🍎 | 4 |
| Orange 🍊 | 🍎🍎 | 2 |
| Grapes 🍇 | 🍎🍎🍎🍎🍎 | 5 |
Reading the pictograph: Mango is the most popular (6 children). Orange is the least popular (2 children). Total = 6 + 3 + 4 + 2 + 5 = 20 children.
Key Words
| Word | Meaning |
|---|---|
| Data | Information we collect about something |
| Tally marks | Lines used to count and record data quickly |
| Pictograph | A chart that uses pictures to show data |
| Most / Maximum | The largest number in the data |
| Least / Minimum | The smallest number in the data |
| Total | The sum of all the numbers |
⭐ Key Points to Remember
- Data is information we collect by counting or asking questions.
- Tally marks help us count quickly. Every 5th mark crosses the group of 4.
- A pictograph uses pictures to show data. Each picture = a number (usually 1).
- We can compare data to find which is most or least.
- To find the total, add all the numbers together.
- To find "how many more", subtract the smaller from the bigger number.
Finished learning? Now test what you know!