Data Handling
Learning Objectives
- Understand what data means and why we collect it.
- Learn to draw and read tally marks.
- Organise data into a tally chart (frequency table).
- Read and draw a simple pictograph.
- Read and draw a simple bar graph.
- Answer questions by reading charts, pictographs, and bar graphs.
What is Data?
Data means information that we collect. When we ask questions and write down the answers, we are collecting data!
For example, if you ask all your classmates "What is your favourite fruit?" and write down their answers — that collection of answers is called data.
But a long list of answers is hard to understand. So we organise data using tally charts, pictographs, and bar graphs to make it easy to read.
Tally Marks
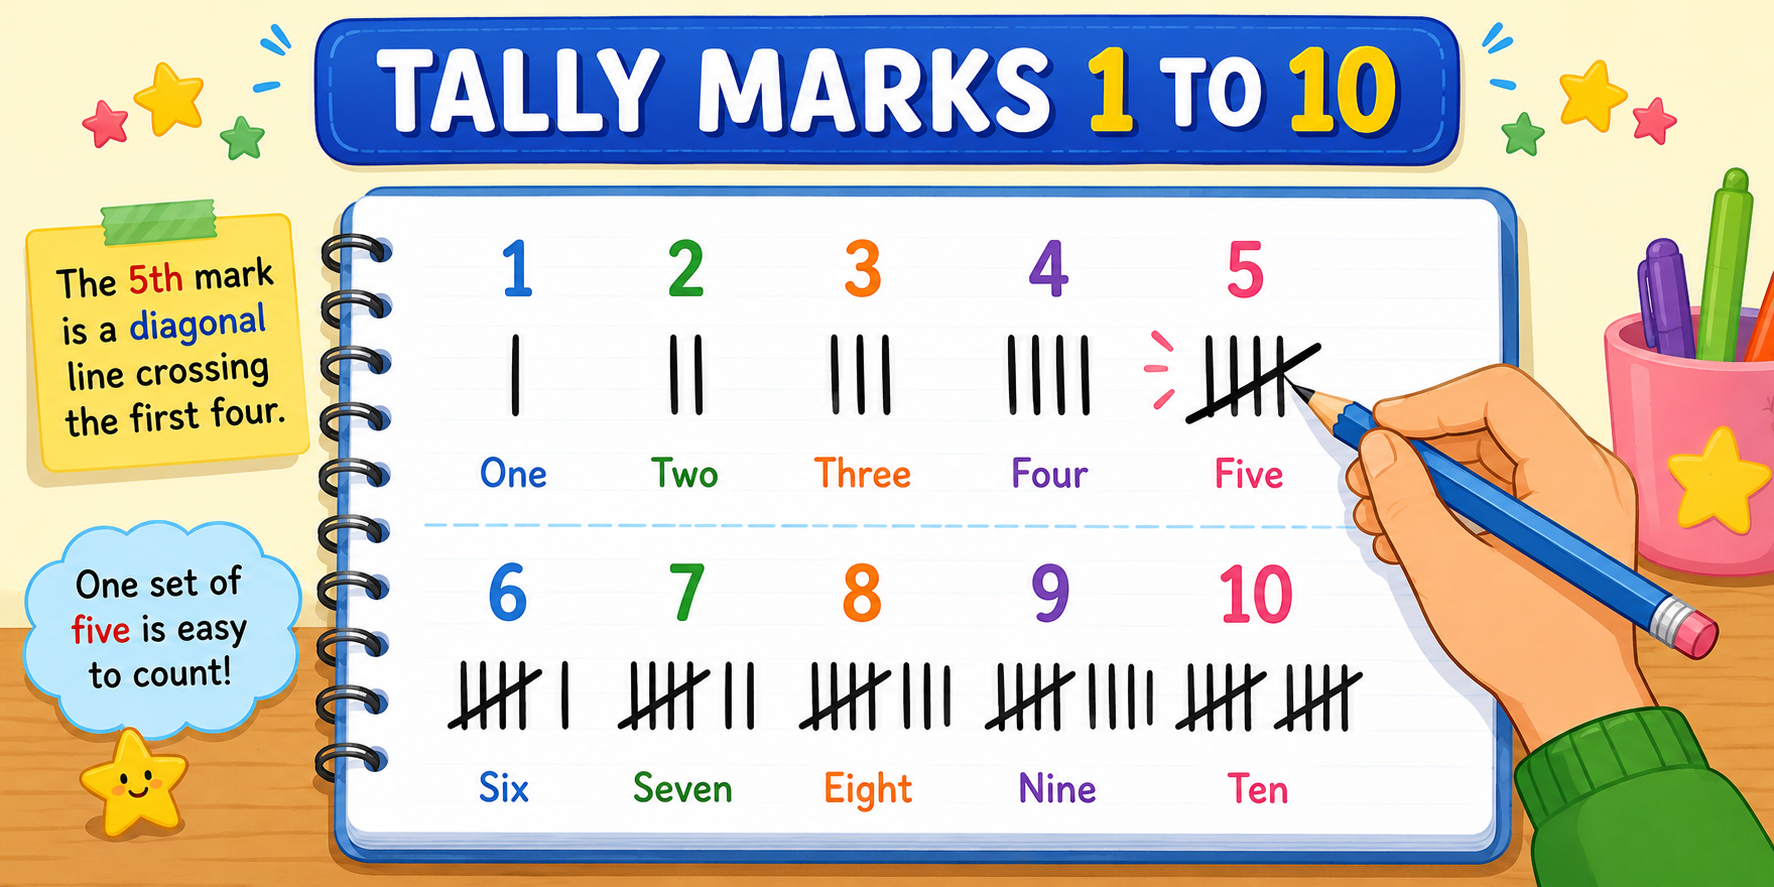
Tally marks are a quick way to count things. We draw one line for each item. After every 4 lines, the 5th line goes across them (like a gate). This makes counting in groups of 5 easy.
| Number | Tally Marks | Number | Tally Marks |
|---|---|---|---|
| 1 | | | 6 | |||| | |
| 2 | || | 7 | |||| || |
| 3 | ||| | 8 | |||| ||| |
| 4 | |||| | 9 | |||| |||| |
| 5 | 10 |
Tally Chart (Frequency Table)
A tally chart organises data into a table with tally marks and totals.
Arjun asked his classmates about their favourite fruit. Here is the tally chart:
| Fruit | Tally Marks | Number of Students |
|---|---|---|
| Mango 🥭 | 8 | |
| Banana 🍌 | 6 | |
| Apple 🍎 | 10 | |
| Grapes 🍇 | |||| | 4 |
| Orange 🍊 | || | 2 |
Questions we can answer from this chart:
- Which fruit is most popular? → Apple (10 students)
- Which fruit is least popular? → Orange (2 students)
- How many more students like Mango than Grapes? → 8 − 4 = 4 more
- Total students surveyed? → 8 + 6 + 10 + 4 + 2 = 30
Pictograph
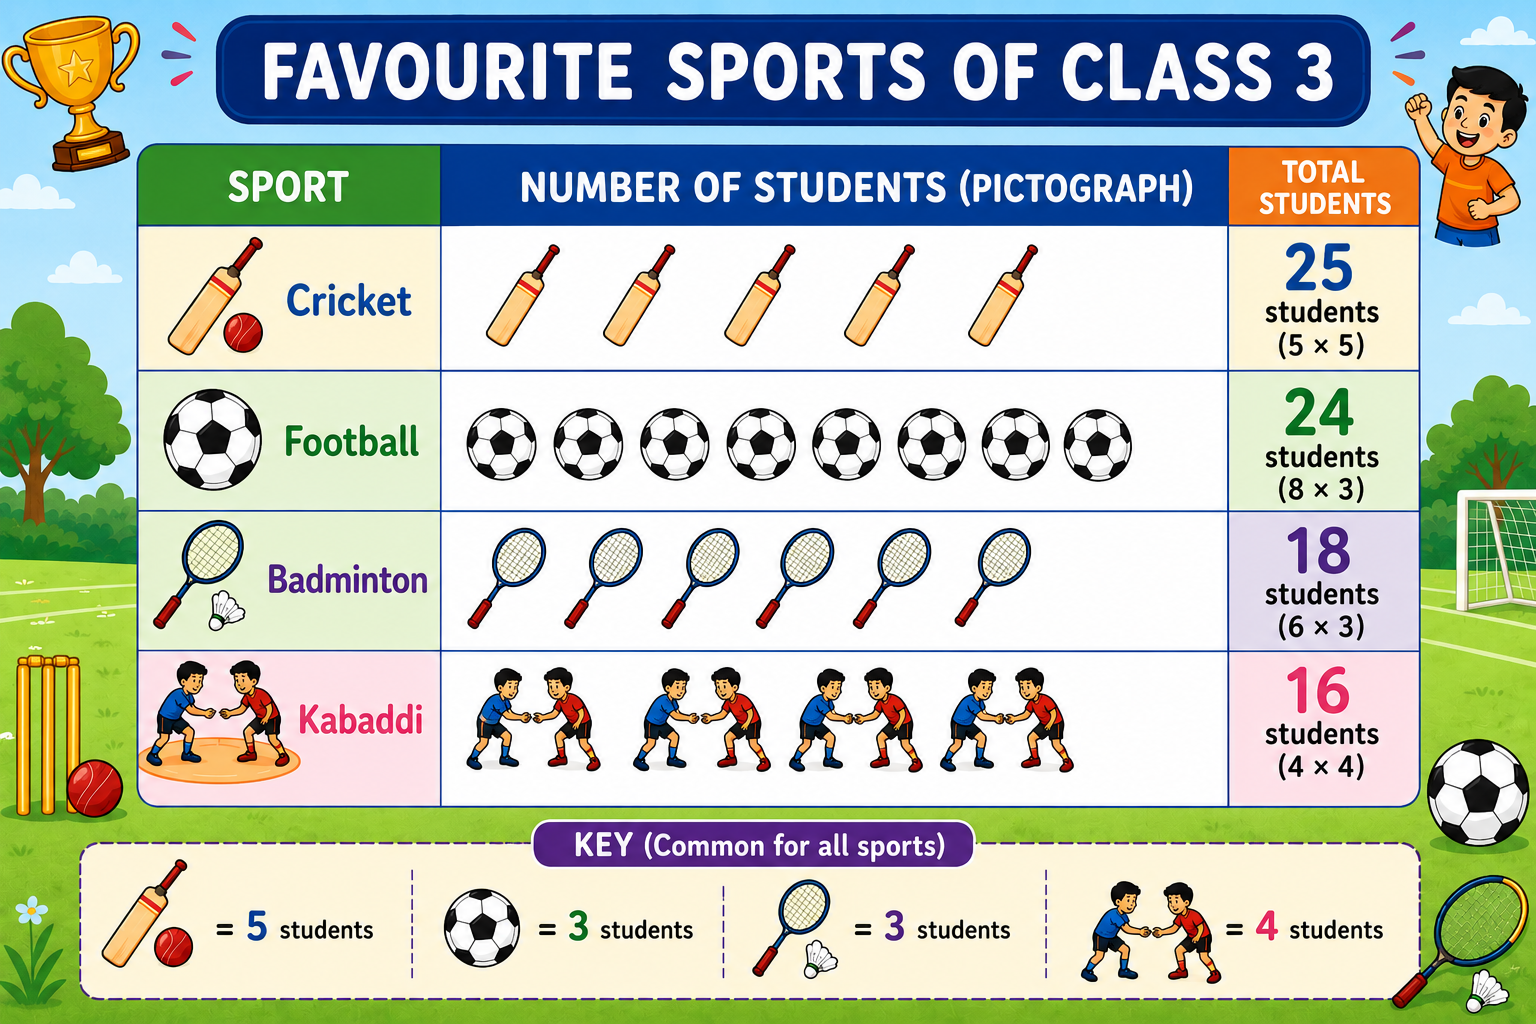
A pictograph uses pictures or symbols to show data. Each picture stands for a certain number of items.
Key: Each 📚 = 2 books
| Student | Books (📚 = 2 books) | Total |
|---|---|---|
| Sita | 📚📚📚 | 6 |
| Ravi | 📚📚📚📚 | 8 |
| Meena | 📚📚 | 4 |
| Arjun | 📚📚📚📚📚 | 10 |
Reading the pictograph:
- Who read the most books? → Arjun (10 books)
- How many books did Sita read? → 3 pictures × 2 = 6 books
- How many more books did Ravi read than Meena? → 8 − 4 = 4 more
Bar Graph
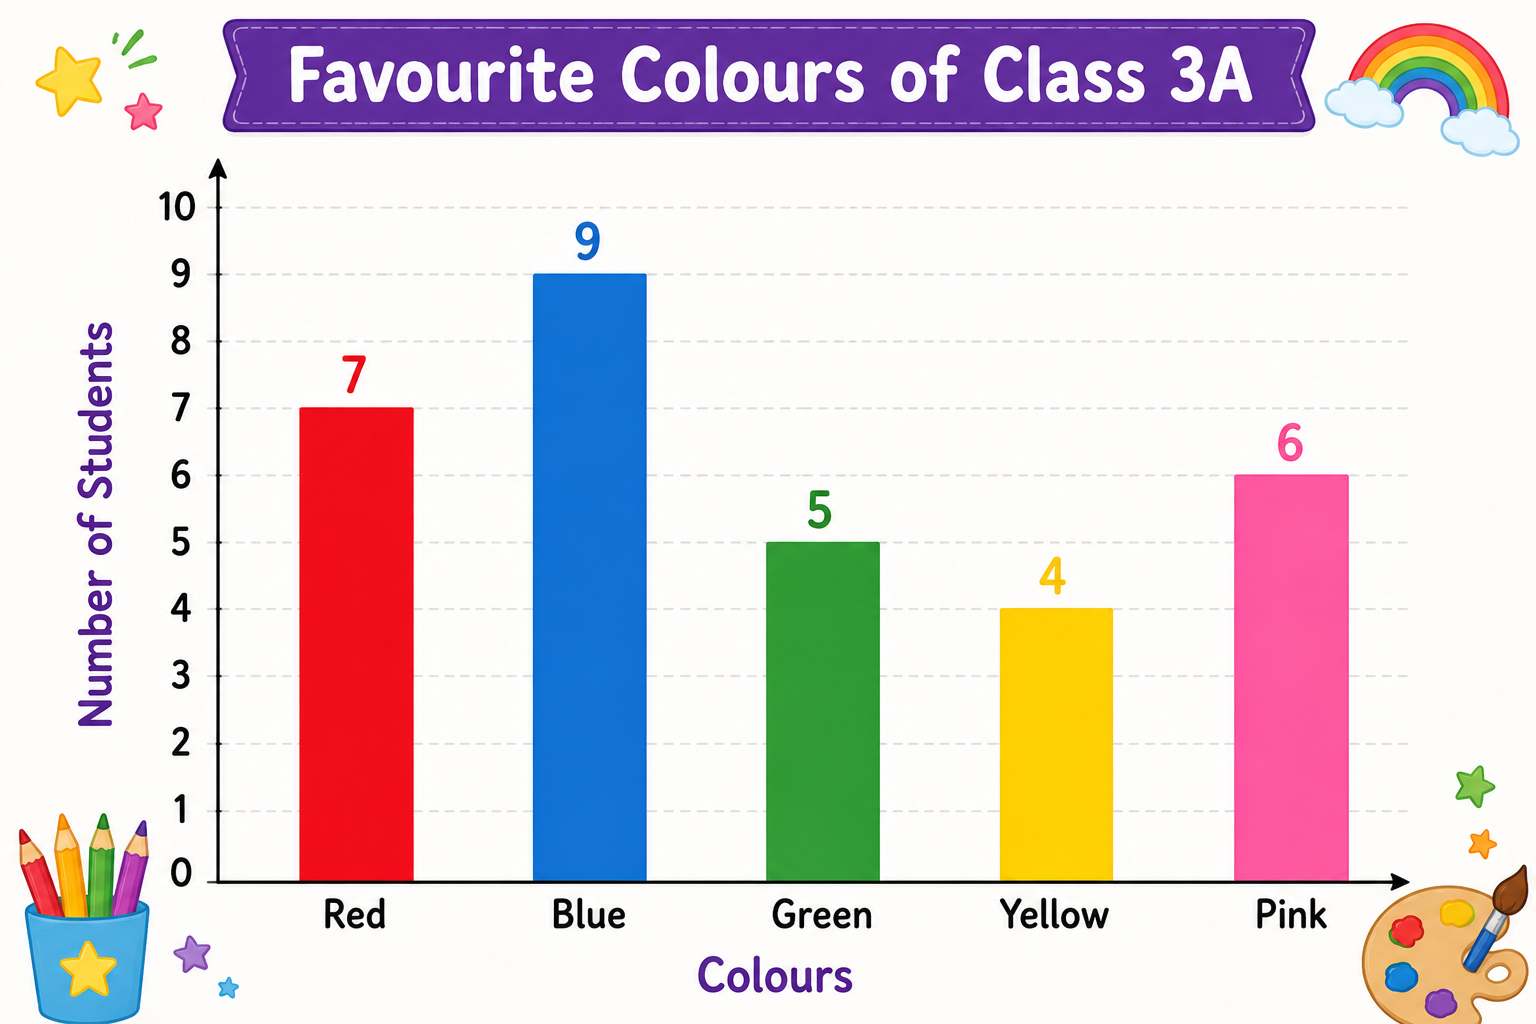
A bar graph uses bars (rectangles) to show data. The taller the bar, the bigger the number. Bar graphs are easy to compare because you can see which bar is tallest at a glance.
Parts of a bar graph:
- Title — tells what the graph is about
- X-axis (horizontal) — shows the categories (e.g., fruits, sports)
- Y-axis (vertical) — shows the numbers (scale)
- Bars — rectangles whose height shows the value
| Colour | Number of Students |
|---|---|
| Red | 7 |
| Blue | 9 |
| Green | 5 |
| Yellow | 4 |
| Pink | 6 |
In a bar graph, Blue would have the tallest bar (9) and Yellow the shortest (4).
How to Draw a Bar Graph
Follow these steps:
- Step 1: Draw two lines — one horizontal (X-axis) and one vertical (Y-axis).
- Step 2: Write the categories on the X-axis (e.g., Red, Blue, Green...).
- Step 3: Write numbers on the Y-axis (0, 1, 2, 3... up to the highest value).
- Step 4: Draw bars for each category. The height of each bar = the number.
- Step 5: Give your graph a title.
Key Words
| Word | Meaning |
|---|---|
| Data | Information collected by asking questions or observing |
| Tally Marks | Lines used to count items in groups of 5 |
| Tally Chart | A table showing data using tally marks |
| Pictograph | A chart using pictures to represent data |
| Bar Graph | A chart using bars (rectangles) to show data |
| Key | Tells what each picture stands for in a pictograph |
| X-axis | The horizontal line in a graph (categories) |
| Y-axis | The vertical line in a graph (numbers) |
- Data = information we collect by asking questions or observing.
- Tally marks: every 5th mark crosses the first 4 (makes counting in 5s easy).
- A tally chart organises data with tally marks and totals.
- A pictograph uses pictures — always check the key to know what each picture means.
- A bar graph uses bars — taller bar = bigger number.
- Always give your graph a title and label the axes.
Finished learning? Now test what you know!